
Epistemic Status: exploratory. I am REALLY not an economist, I don’t even play one on TV.
You can call it by a lot of names. You can call it crony capitalism, the mixed economy, or corporatism. Cost disease is an aspect of the problem, as are rent-seeking, regulatory capture, and oligopoly.
If Scrooge McDuck’s downtown Duckburg apartment rises in price, and Scrooge’s net worth rises equally, but nothing else changes, the distribution of purchasing power is now more unequal — fewer people can afford that apartment. But nobody is richer in terms of actual material wealth, not even Scrooge. Scrooge is only “richer” on paper. The total material wealth of Duckburg hasn’t gone up at all.
I’m concerned that something very like this is happening to developed countries in real life. When many goods become more expensive without materially improving, the result is increased wealth inequality without increased material abundance.
The original robber barons (Raubritter) were medieval German landowners who charged illegal private tolls to anyone who crossed their stretch of the Rhine. Essentially, they profited by restricting access to goods, holding trade hostage, rather than producing anything. The claim is that people in developed countries today are getting sucked dry by this kind of artificial access-restriction behavior. A clear-cut example is closed-access academic journals, which many scientists have begun to boycott; the value in a journal is produced by the scholars who author, edit, and referee papers, while the online journal’s only contribution is its ability to restrict access to those papers.
Scott Alexander said it right:
LOOK, REALLY OUR MAIN PROBLEM IS THAT ALL THE MOST IMPORTANT THINGS COST TEN TIMES AS MUCH AS THEY USED TO FOR NO REASON, PLUS THEY SEEM TO BE GOING DOWN IN QUALITY, AND NOBODY KNOWS WHY, AND WE’RE MOSTLY JUST DESPERATELY FLAILING AROUND LOOKING FOR SOLUTIONS HERE.
Except that it’s pretty easy to see why. We have a lot of trolls sitting under bridges charging tolls to people who want to cross. Modern Raubritter can easily maintain a hard-to-refute image that they’re providing value, and so make it hard for anyone to coordinate to avoid them. It’s genuinely risky to unilaterally skip college, refuse to publish in closed-access journals, or leave an expensive city with a booming economy. You know you’re being charged a ton for some stuff you don’t want or need, but it’s hard to tell where exactly the waste is; it’s dissipated and concealed and difficult to disentangle. As 19th century businessman John Wanamaker said, “Half the money I spend on advertising is wasted; the problem is, I don’t know which half.”
But, for now, let’s try to get a factual picture of what’s actually going on.
Stagnant Commodity-Denominated Growth
GDP is supposed to be adjusted for inflation, but the calculation of the inflation rate is pretty political and might be misleading. What happens if you instead denominate in commodities?
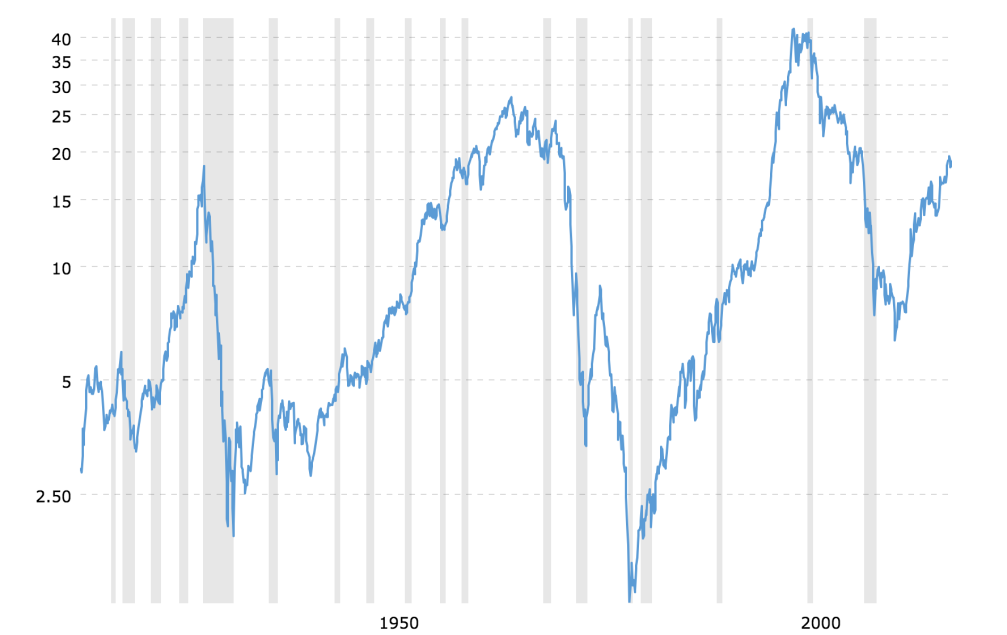
This is the Dow-to-gold ratio for the past 100 years; as you can see, there are three major contractions in the places you’d expect: one in the Great Depression, an even deeper one that began around 1972, and the most recent in the Great Recession that began in 2008.
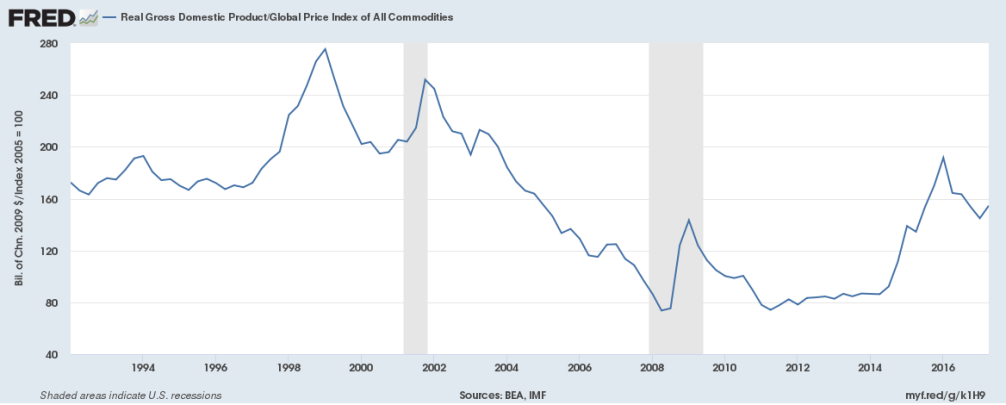
You get a similar picture looking at the US GDP-to-gold ratio:

and the global GDP-to-gold ratio:
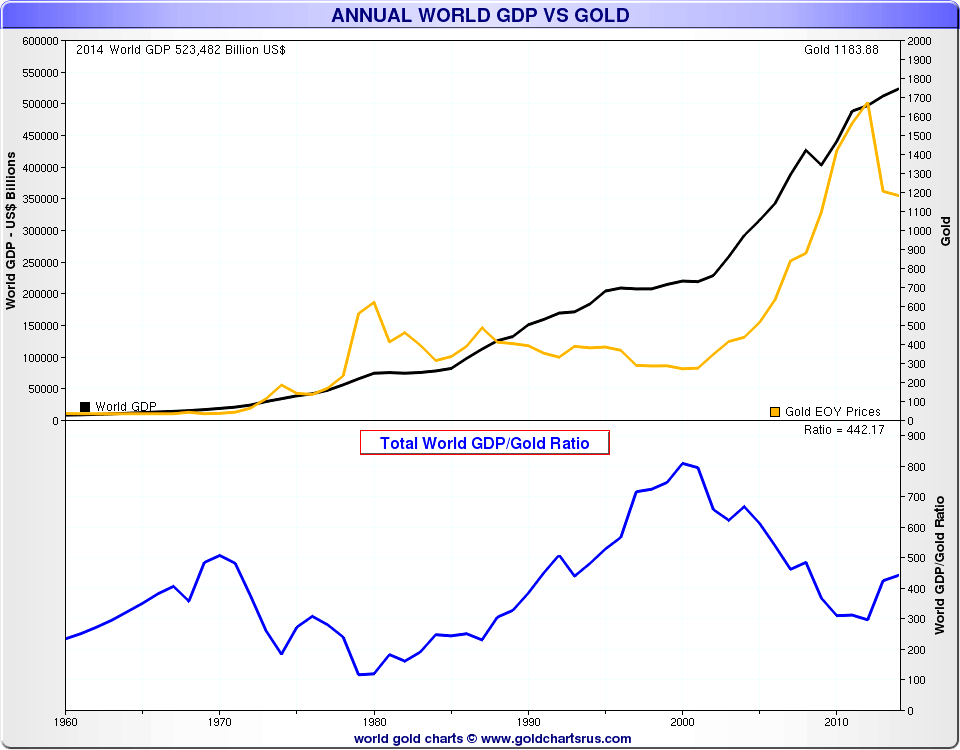
In 100 years we’re looking at something like an average of 1.4% growth in gold-denominated stocks or GDP; and gold-denominated GDP is comparable to where it was in the 1980’s.
But maybe that’s just gold. What about GDP denominated in other commodity prices? Here’s US GDP in terms of crude oil prices:
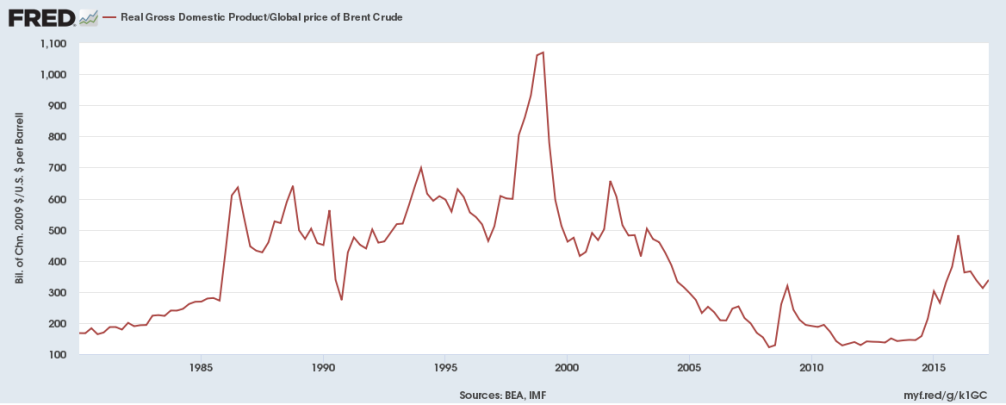
Once again, this shows US GDP never really recovering from the 2001 tech bust, and not being much higher than where it was in the 80’s.
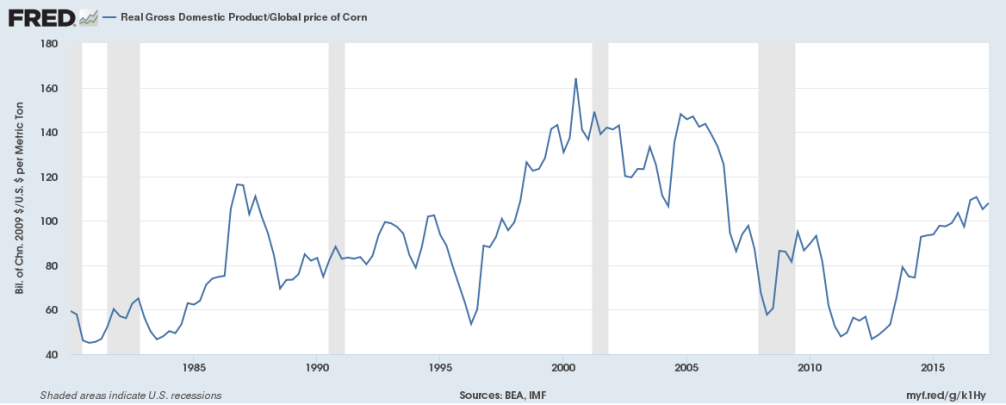
Compared to the global price of corn, again, US GDP barely seems to have an upward trend since 1980; something like 1.5% growth.
Compared to a global commodities index, once again, GDP seems no higher than it was in the 90’s.
This should make us somewhat suspicious that “real” GDP growth is overestimating growth in material wealth.
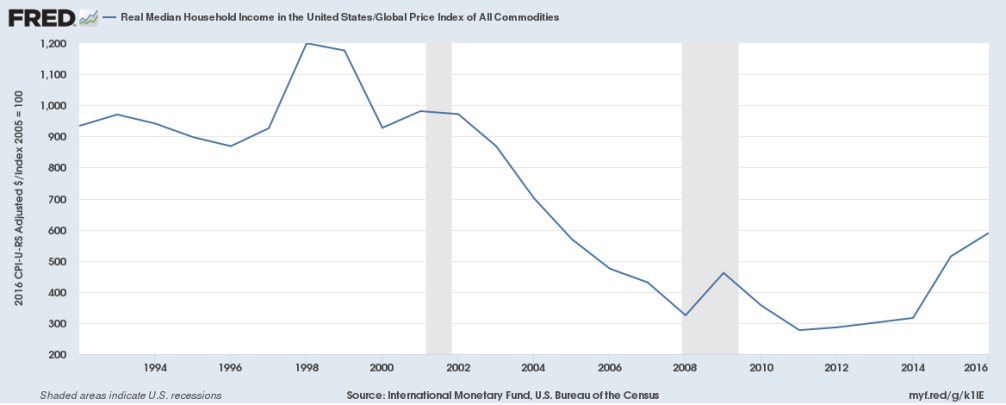
Of course, since median income has grown slower than GDP, this means that median income relative to commodities has actually dropped in recent decades.
Stagnant Productivity
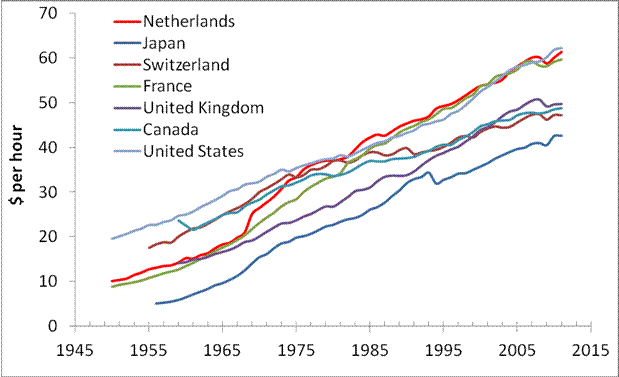
Labor productivity, in dollars per hour, has risen pretty steadily in advanced economies over the past half-century.
On the other hand, total factor productivity, the return on dollars of labor and capital, seems to have stagnated:
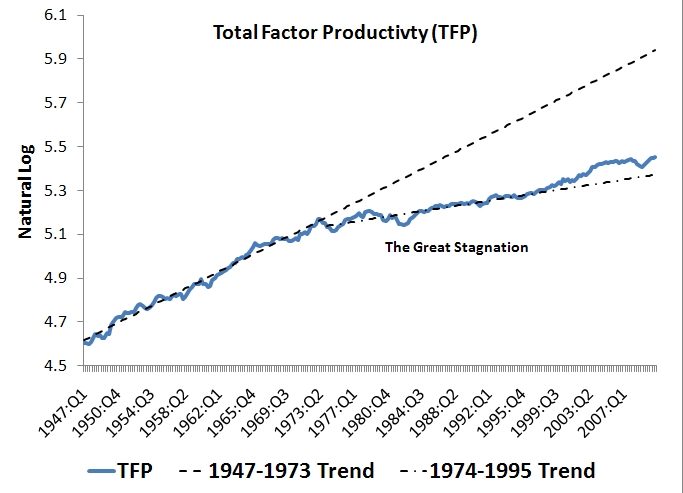
Total factor productivity is thought to include phenomena such as technological improvement, good institutions and governance, and culture. It’s been stagnating in other developed countries, not just the US:

A Brookings Institute report broke down US total factor productivity by sector, and concluded that the declining growth from 1987 to today was in services and construction, while manufacturing and other sectors continued to improve:
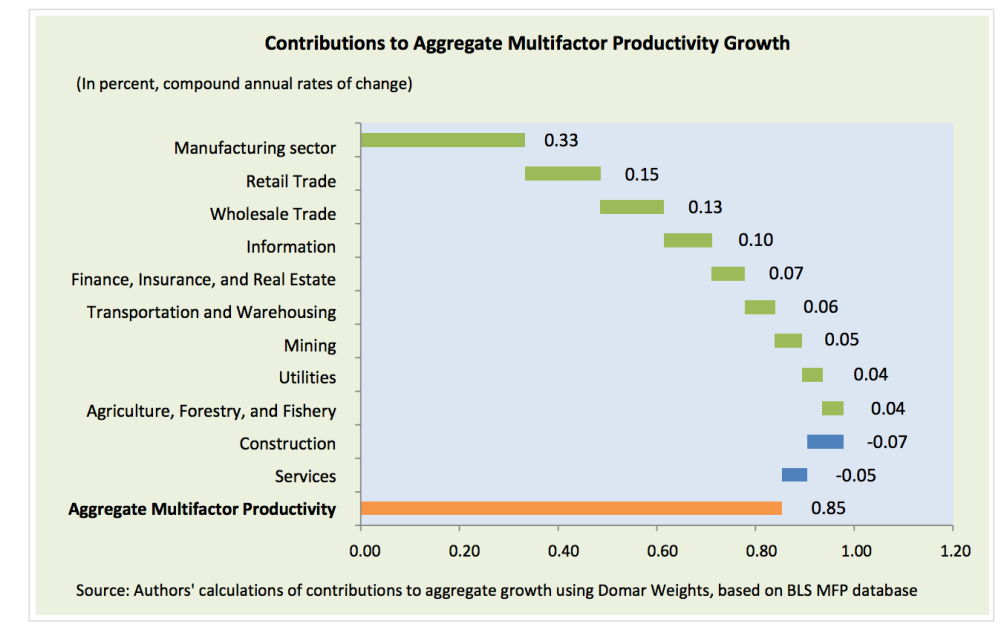
Services and construction, please note, pretty much match the “cost disease” sectors whose prices are rising faster than the rest of the economy can grow: education, housing, transportation, and especially healthcare. As services become more expensive, they’re also becoming less efficient.
Declining productivity means that we’re doing less with more. This is particularly true for innovation, where, for instance, we’re not getting much increase in crop yields despite huge increases in the number of agricultural researchers, and not getting much increase in lives saved despite increasing volume of medical research.


Monopoly and Declining Dynamism
The Herfindahl Index is a measure of market concentration, defined by the sum of the squares of the market shares of firms in an industry. (If a single firm held a monopoly it would be 1; if N firms each had equal shares, it would be 1/N.)
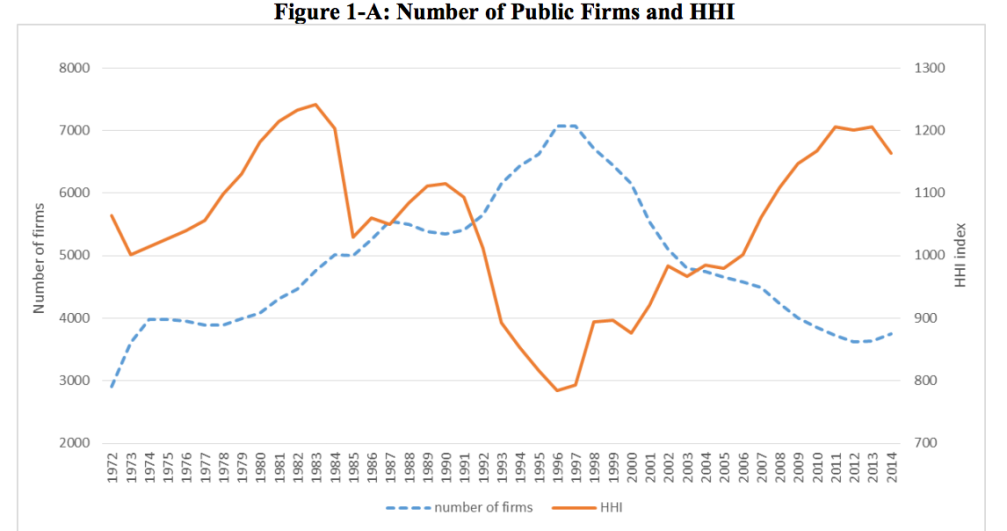
US industries have become more concentrated since the mid-1990s, with the number of firms dropping and the Herfindahl index rising:
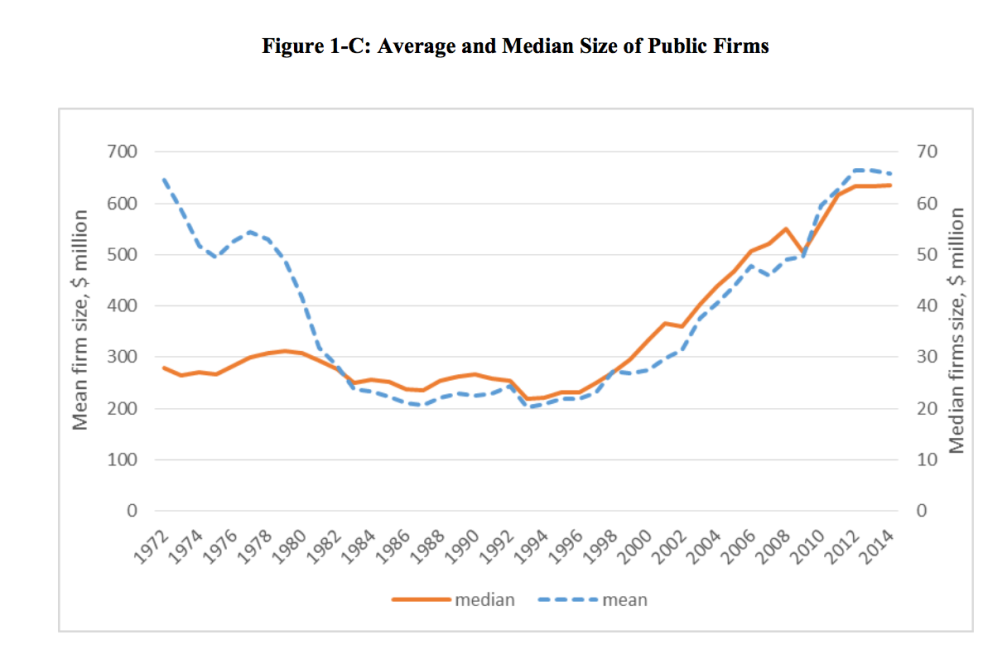
Firms have also gotten larger:
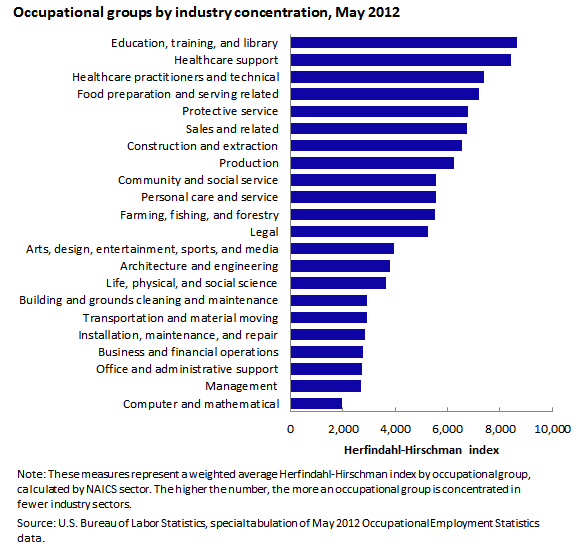
You can also look at concentration in terms of employment. Education and healthcare are the most concentrated industries by occupation, while computers are the least:
There has been a steady increase in market power since 1980, with markups rising from 18% above cost in 1980 to 67% above cost in 2014.
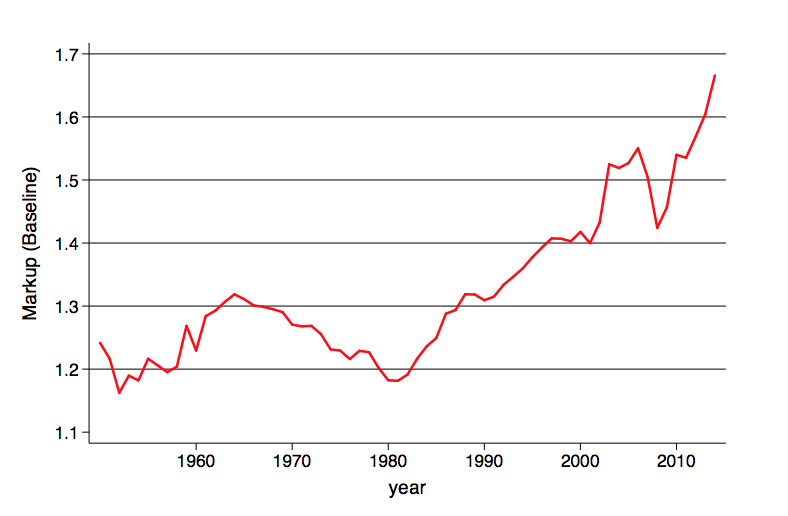
More concentrated industries can charge higher prices relative to costs.
As industries are becoming more concentrated, they’re also becoming more static. Fewer new firms are being created:
.jpg?1416512353)
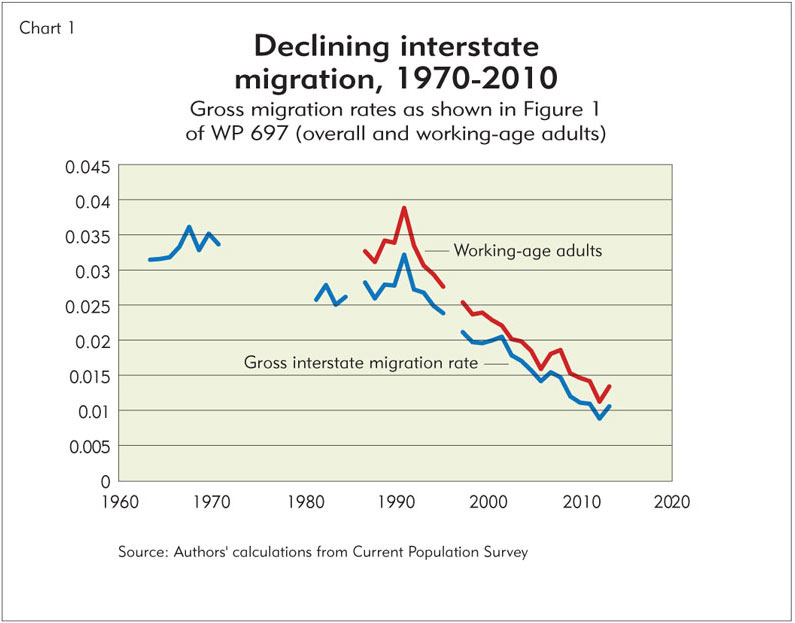
Americans are moving less between states:
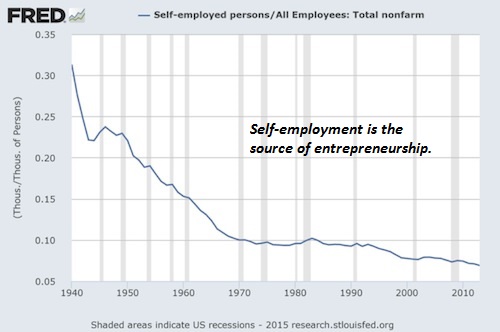
And self-employment is dropping:
As market power increases (i.e. as industries become more monopolistic), you can get a scenario where the financial value of firms outpaces their investment in capital or their spending on labor.

With an increase in market power, the share of income consisting of pure rents increases, while the labor and capital shares both decrease. Finally, the greater monopoly power of firms leads them to restrict output. In restricting their output, firms decrease their investment in productive capital, even in spite of low interest rates.
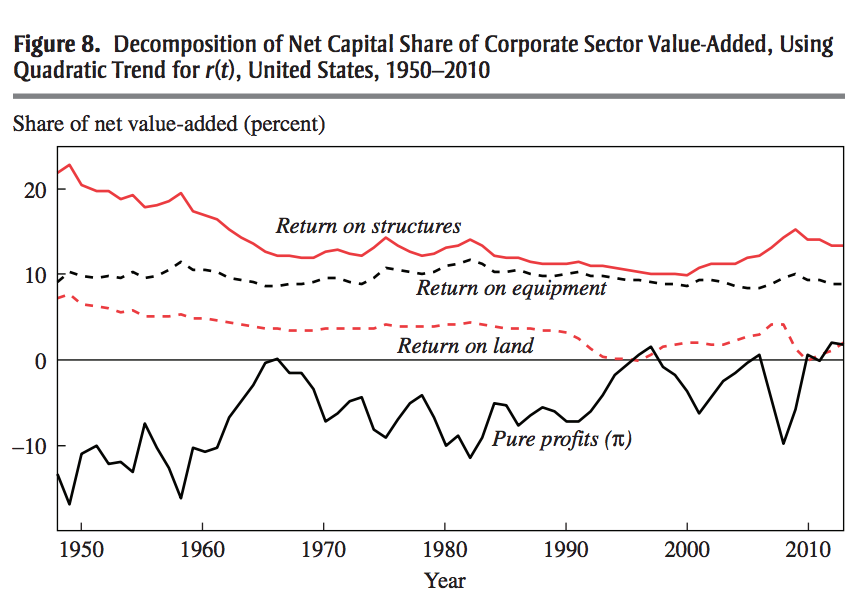
If you divide the economy into “capital” and “labor”, you find a long-term decline in the share of labor and increase in the share of capital. But if you decompose the capital share, you find that the returns on structures, land, and equipment are static or declining, while pure profits are on an upward trajectory:
This story is consistent with other long-term trends, like the increasing share of the value of firms that consists of intangibles — that is, “the value of things you couldn’t easily copy, like patents, customer goodwill, employee goodwill, regulator favoritism, and hard to see features of company methods and culture.

Those intangibles constitute barriers to entry, precisely because they can’t be easily copied by new firms. The rise of intangibles is also a sign of a more monopolistic economy.
It’s Not (Just) Regulation
Alex Tabarrok, a libertarian economist, argues that the decline in dynamism is not due to regulation.
Since the 1970’s, the most stringently regulated industry by far has been manufacturing:

(“FIRE” here refers to finance, insurance, and real estate.)
However, more stringently regulated industries are not less dynamic:

Some of these results are weird, since #622, marked as a lightly regulated industry, is “Hospitals”, which I don’t really think of as freewheeling. Maybe these numbers don’t include indirect effects like occupational licensing for medical professionals restricting the supply of people to work in hospitals.
But at any rate, regulations are not the only way to enforce monopoly power, and it seems that they’re not the decisive factor. Governments have means other than regulation to promote monopoly (for instance, grants, contracts, or subsidies to insider firms, or increases in the scope of what can be patented and for how long). And there are purely private mechanisms (like prestige/signaling in the scientific publishing industry) that can preserve monopolies as well.
Problems for the Middle and Lower Classes
US income inequality is rising; in real dollar terms, this looks like the rich getting richer while everyone else stays the same:

On the other hand, it’s worth moderating this picture by awareness of cost disease. High-income people as well as lower-income people are spending a larger fraction of their budget on housing and healthcare, which aren’t really improving much in quality.

Income mobility is also dropping:

Some Slogans
Why is monopoly bad?
Monopoly drives up prices while depressing production. That means we have fewer nice things. Yes, even for the “winners” of this negative-sum game, though of course the problem is worse for everyone else.
Monopoly and lack of innovation go together, since monopolists have less incentive to produce or compete.
Monopoly and intangibles go together. Branding is a form of market power. As are patents.
Monopoly causes inequality; it also causes absolute economic insecurity (if necessities cost more, the poor are most harmed).
Monopoly is anti-meritocratic. It’s a troll guarding a bridge, not a hardworking genius inventor.
None of this tells us what to do about monopoly. I’m not at all confident that antitrust law works or is a fair solution to the problem. There’s also reason to doubt that deregulation would fix everything, though fixing zoning and occupational licensing laws seems like it would at least help.
